Box truck business statistics: sourced facts for 2026
Most "box truck statistics" pages online repeat numbers with no source or a source that doesn't say what they claim. These box truck business statistics are different: each figure below names its publisher, the period it covers and the date we checked it, and none is our estimate unless it says so. Where no public source exists for something people often ask, like average box truck profit, we say that instead of filling the gap.
Key finding
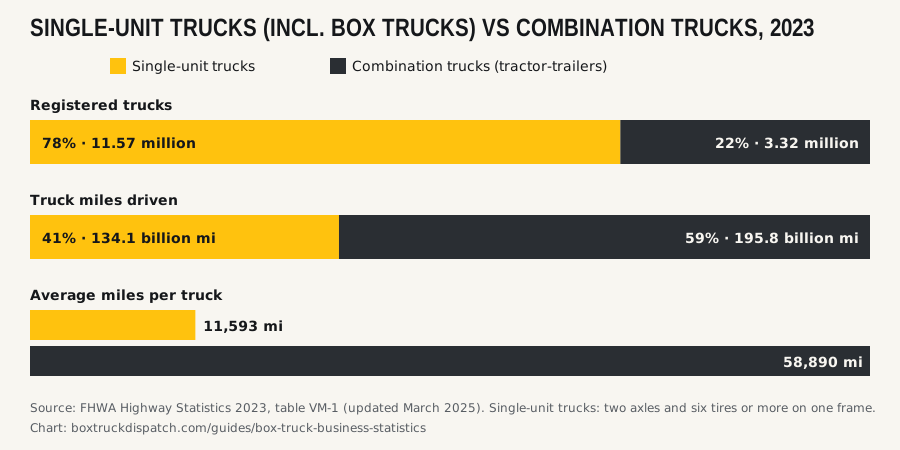
Single-unit trucks, the federal category that includes box trucks, made up 78 percent of registered U.S. trucks in 2023 but drove 41 percent of truck miles. The average single-unit truck ran 11,593 miles that year, about a fifth of a tractor-trailer's 58,890.
How many box trucks are on the road
No federal dataset counts box trucks by themselves. The closest official figures are FHWA's for single-unit trucks: trucks on a single frame with at least two axles and six tires, which covers box trucks along with dump trucks, stake bodies and other straight trucks.
| Statistic | Value | Period | Publisher |
|---|---|---|---|
| Registered single-unit trucks | 11,567,428 | 2023 | FHWA, VM-1 |
| Registered combination trucks (tractor-trailers) | 3,324,112 | 2023 | FHWA, VM-1 |
| Miles driven by single-unit trucks | 134.1 billion | 2023 | FHWA, VM-1 |
| Average miles per single-unit truck | 11,593 | 2023 | FHWA, VM-1 |
| Average fuel economy, single-unit trucks | 7.8 mpg | 2023 | FHWA, VM-1 |
| Single-unit share of registered trucks | 77.7% | 2023 | Our calculation from FHWA |
| Single-unit share of truck miles | 40.7% | 2023 | Our calculation from FHWA |
Single-unit truck registrations rose from 11,049,522 in 2022 to 11,567,428 in 2023 in the same table, while miles per truck fell from 12,328 to 11,593. More trucks, each driving a little less.
Box truck drivers: jobs and pay
BLS splits truck drivers at the CDL weight line. Light truck drivers drive trucks under 26,001 lb, which includes most 26 ft box trucks; heavy and tractor-trailer drivers drive trucks over 26,000 lb.
| Statistic | Value | Period | Publisher |
|---|---|---|---|
| Light truck driver jobs | about 1,068,500 | 2025 | BLS |
| Projected growth, light truck drivers | 6% | 2025 to 2035 | BLS |
| Median annual wage, light truck drivers | $44,860 | May 2025 | BLS |
| Median annual wage, heavy and tractor-trailer drivers | $58,640 | May 2025 | BLS |
| Projected openings a year, delivery truck drivers and driver/sales workers | about 152,700 | 2025 to 2035 | BLS |
These are employee wages. An owner-operator's income is revenue minus every cost, and no public source reports an average for box truck owner-operators. What that math looks like is in our box truck owner-operator guide.
Operating costs
The best-known public cost benchmark comes from ATRI's annual study of trucking fleets. It is built from heavy truck carriers in sectors such as truckload, refrigerated, tank and LTL, not box trucks, so use it as context, not as your number.
| Statistic | Value | Period | Publisher |
|---|---|---|---|
| Industry average cost to operate a truck | $2.336 per mile | 2025 | ATRI (July 2026) |
| Industry average cost, excluding fuel | $1.854 per mile | 2025 | ATRI (July 2026) |
| Change in total cost from 2024 | +3.4% | 2025 | ATRI |
| Truckload and refrigerated operating margins | under 1.0% | 2025 | ATRI |
| U.S. average on-highway diesel price | $6.276 per gallon | week of Oct 19, 2026 | EIA |
A 26 ft box truck usually costs less per mile than a tractor-trailer (lighter truck, better fuel economy, cheaper tires), but it also earns less per load. Build your own cost per mile from your real bills; our box truck business plan template has a worksheet.
Getting started: official fees
| Item | Cost | Period | Publisher |
|---|---|---|---|
| USDOT number | Free | Current | FMCSA |
| MC operating authority | $300 per authority type | Current | FMCSA |
| UCR registration, 0 to 2 trucks | $46 | 2026 registration year | UCR Plan |
| UCR registration, 0 to 2 trucks | $55 | 2027 registration year | UCR Plan |
The truck, insurance and working capital are the big numbers, and they vary too much for one figure. Our guide on how to start a box truck business walks through every step with official links.
Safety
| Statistic | Value | Period | Publisher |
|---|---|---|---|
| Deaths in crashes involving large trucks (over 10,000 lb GVWR) | 5,340 | 2024 | IIHS, from FARS |
| Deaths in crashes involving single-unit trucks | 1,957 (37%) | 2024 | IIHS, from FARS |
| Share of large truck crash deaths who were truck occupants | 17% | 2024 | IIHS |
| Vehicle strikes to bridges in Kansas | 377 | 2025 | Kansas DOT |
| Strikes to bridges or overhead structures in Pennsylvania | more than 600 | 2013 to 2023 | PennDOT |
IIHS notes that more than one truck can be involved in a crash, so truck-type rows can overlap. Bridge strikes are a box truck problem in particular; both state DOTs name rental and delivery box trucks in their campaigns.
Parking
| Statistic | Value | Period | Publisher |
|---|---|---|---|
| Truck parking spaces nationwide | about 313,000 | 2019 | FHWA Jason's Law survey |
| Spaces at public rest areas | about 40,000 | 2019 | FHWA |
| Spaces at private truck stops | about 273,000 | 2019 | FHWA |
| Drivers reporting problems finding safe parking | 98% | 2019 | FHWA |
What we couldn't find
People often ask for these, but we found no public, sourced figure we would stand behind, so we don't publish one:
- Average box truck rate per mile or pay per load
- Average box truck business profit or owner-operator income
- A national count of box trucks specifically, or of box truck businesses
- Final mile market size figures that are not behind a paywall
If you know a public source for any of these, tell us and we will check it.
Methodology
We use only publications from government agencies and established research organizations, quoted as published, with the period each figure covers. Percentages marked as our calculation are simple shares of the published counts. Figures are not adjusted or modeled. Where a source covers a broader group than box trucks (single-unit trucks, light truck drivers, heavy fleets), the table says so.
Update schedule: reviewed every quarter, and when FHWA, BLS, ATRI or IIHS publish a new edition. Next review: January 2027. Spot an error? Tell us and we will check it against the source.
These numbers describe the market. Your truck's numbers are what matter for your business: the loads it gets and what they pay. That is what our box truck dispatch service works on every day, and if you are starting from scratch, see where box truck loads come from.
FAQ
How many box trucks are there in the U.S.?
No federal source counts box trucks on their own. The closest official number is FHWA's count of single-unit trucks, the category box trucks belong to: 11,567,428 registered in 2023. That category also includes dump trucks, stake bodies and other straight trucks.
Is there an average box truck profit figure?
No public source reports an average box truck profit, and we don't invent one. ATRI's 2026 cost study, which covers heavy truck fleets, put 2025 operating costs at $2.336 per mile and reported truckload margins under 1 percent. Run your own numbers in a profit calculator before you buy.
How much do box truck drivers make?
BLS reports a median annual wage of $44,860 for light truck drivers (trucks under 26,001 lb, which includes most 26 ft box trucks) and $58,640 for heavy and tractor-trailer truck drivers, both for May 2025. Owner-operators earn revenue minus costs, not a wage.
How many miles does a box truck drive per year?
FHWA's 2023 figure for the average single-unit truck is 11,593 miles. Box trucks used for regional freight often run far more, and delivery trucks on short routes less, so use your own plan for budgeting.
Can I use these statistics on my site?
Yes. Quote them with the original publisher and our page as the source, or use the embed code under the chart, which includes the credit link. The CSV download has every figure with its source URL.
Sources
- FHWA: Highway Statistics 2023, table VM-1 (updated March 2025) (checked October 2026)
- BLS Occupational Outlook Handbook: delivery truck drivers and driver/sales workers (2025 data) (checked October 2026)
- BLS Occupational Outlook Handbook: heavy and tractor-trailer truck drivers (May 2025 wages) (checked October 2026)
- ATRI: New ATRI report details accelerating costs and low profitability despite cuts (July 15, 2026) (checked October 2026)
- IIHS: Fatality Facts, large trucks (FARS data through 2024) (checked October 2026)
- FHWA: Jason's Law truck parking survey update (December 1, 2020) (checked October 2026)
- FMCSA: cost of obtaining operating authority (checked October 2026)
- UCR Plan: fee brackets (2026 and 2027) (checked October 2026)
- U.S. EIA: gasoline and diesel fuel update (week of Oct 19, 2026) (checked October 2026)
- Kansas DOT: Check Your Height, Know It's Right (2025 bridge strike data) (checked October 2026)
- PennDOT: campaign to prevent bridge hits (July 22, 2025) (checked October 2026)